1.
Introduction
Storytelling using data visualization has been identified as a potent tool for enhancing understanding and engagement with complex and historical events like the Holocaust. Educational enlightenment and inclusive didactics using multimedia and statistical data are especially important for such highly emotional and ongoing topics (Baldwin and Ching, 2017 / Segel and Heer, 2010).
Testimonies play a crucial role in understanding the Holocaust, and the impact of vicarious witnessing through images, videos, testimonies, and stories, providing deeper insights into historical events like the Holocaust in education, has been proven (Keats, 2005, Pagenstecher / Wein, 2017). The proposed poster leverages such testimonies to detail the conditions in the camps, biographies, and fates of individuals, aiming to employ visualization tools to narrate the harrowing experiences of Holocaust processes, victims, their art, and persecutors.
To model such entities, the InTaVia
1
knowledge graph, for example, resembles tangible and intangible European cultural heritage, focusing on a variety of entity classes, depicting stories in the form of persons, objects, groups, and places that are connected through their related events (Mayr et al., 2022). Part of the holistic workflow approach within the InTaVia platform is the communication of findings through interactive and visualization-based storytelling (Liem et al., 2023). This poster proposes the holistic combination of these databases and tools to highlight, communicate, and teach the value of the cultural heritage of memories.
The critical role of visual imprints in Holocaust survivors' testimonies, serving as unaltered echoes of their experiences, is pointed out by Alphen (2002). The use of those artworks, their three-dimensionalized derivates, and interactive visualization elements in the proposed approach is supported by research demonstrating that incorporating interaction techniques in data visualization stimulates insights and enhances understanding (Alexandre, 2016). These techniques make scenes and sites from the Holocaust interactively explorable, offering a more immersive experience and seamless transitions through different story states of individuals or groups, and allow for audience-targeted designs of storytelling (Sauer et al., 2016). In the context of the Holocaust, this involves being precise and addressing different victim groups' perspectives (Sinker, 2017).
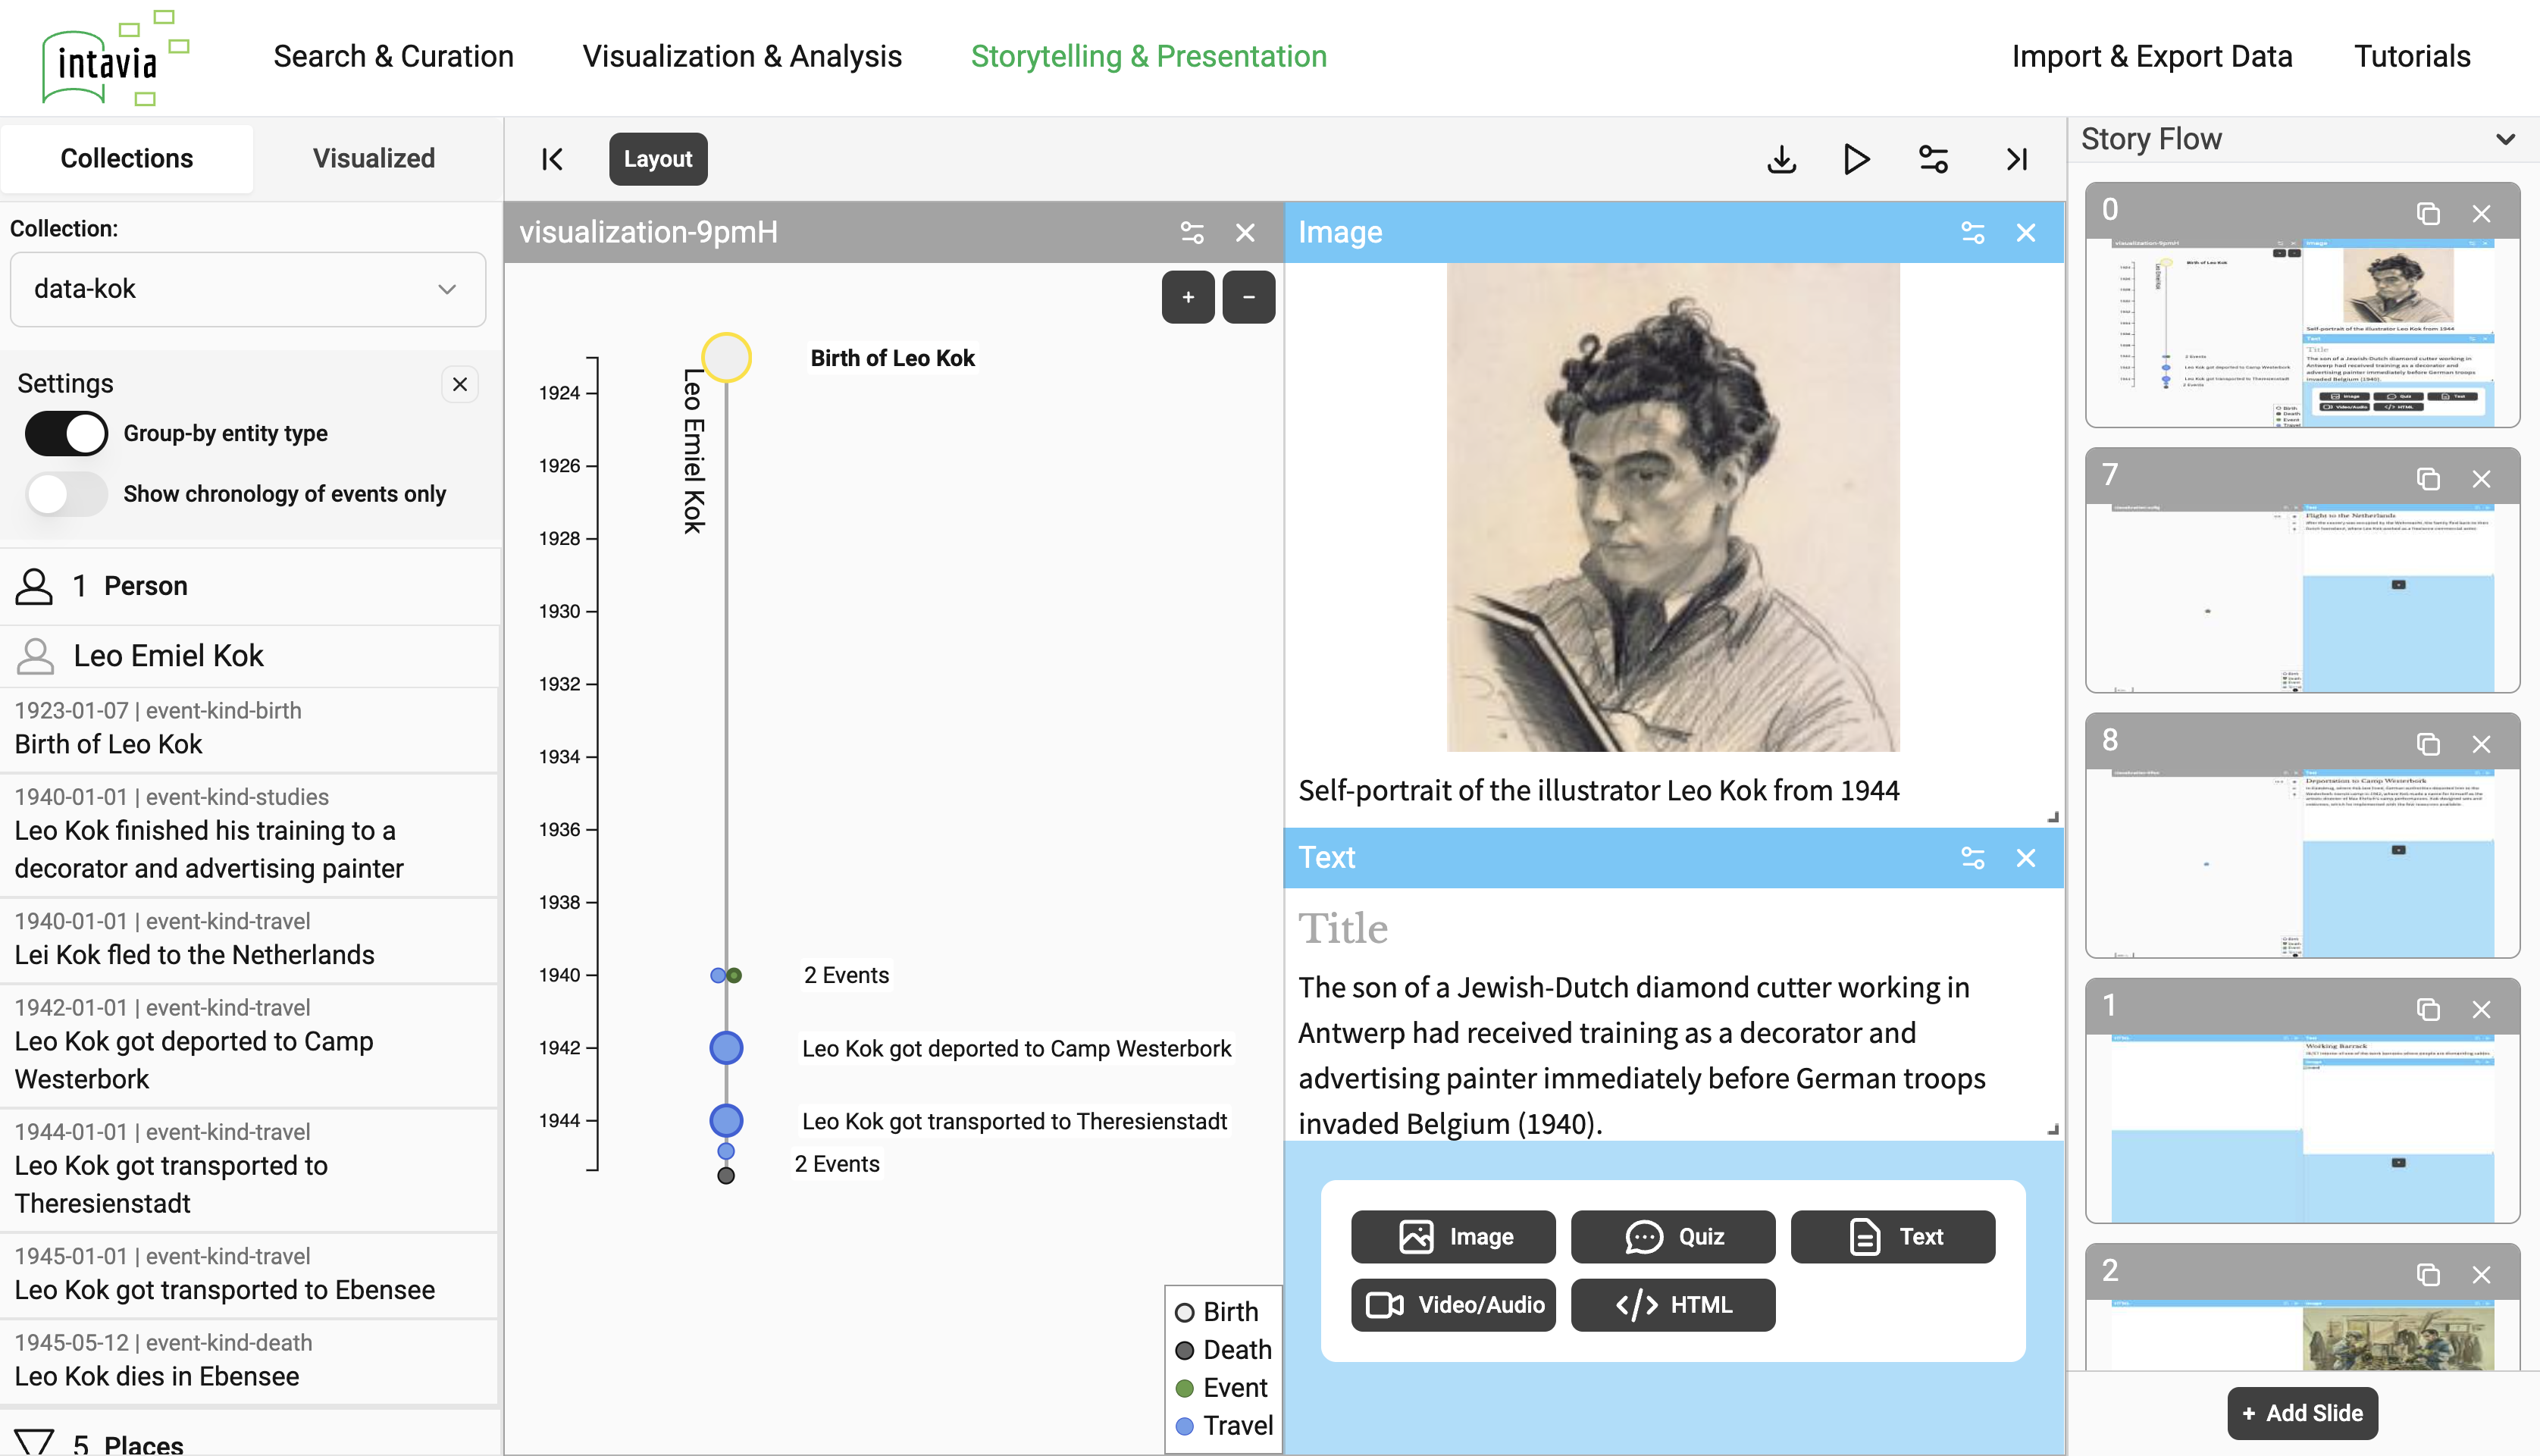
For the visualization-based storytelling in a synoptic approach from data curation to communication in the form of interactive slideshows, we utilize the InTaVia frontend, offering three different visualizations - timelines, maps, and network graphs - to depict temporal, geospatial, and relational information and developments (through animated transitions) within the stories.
2.
Use Case
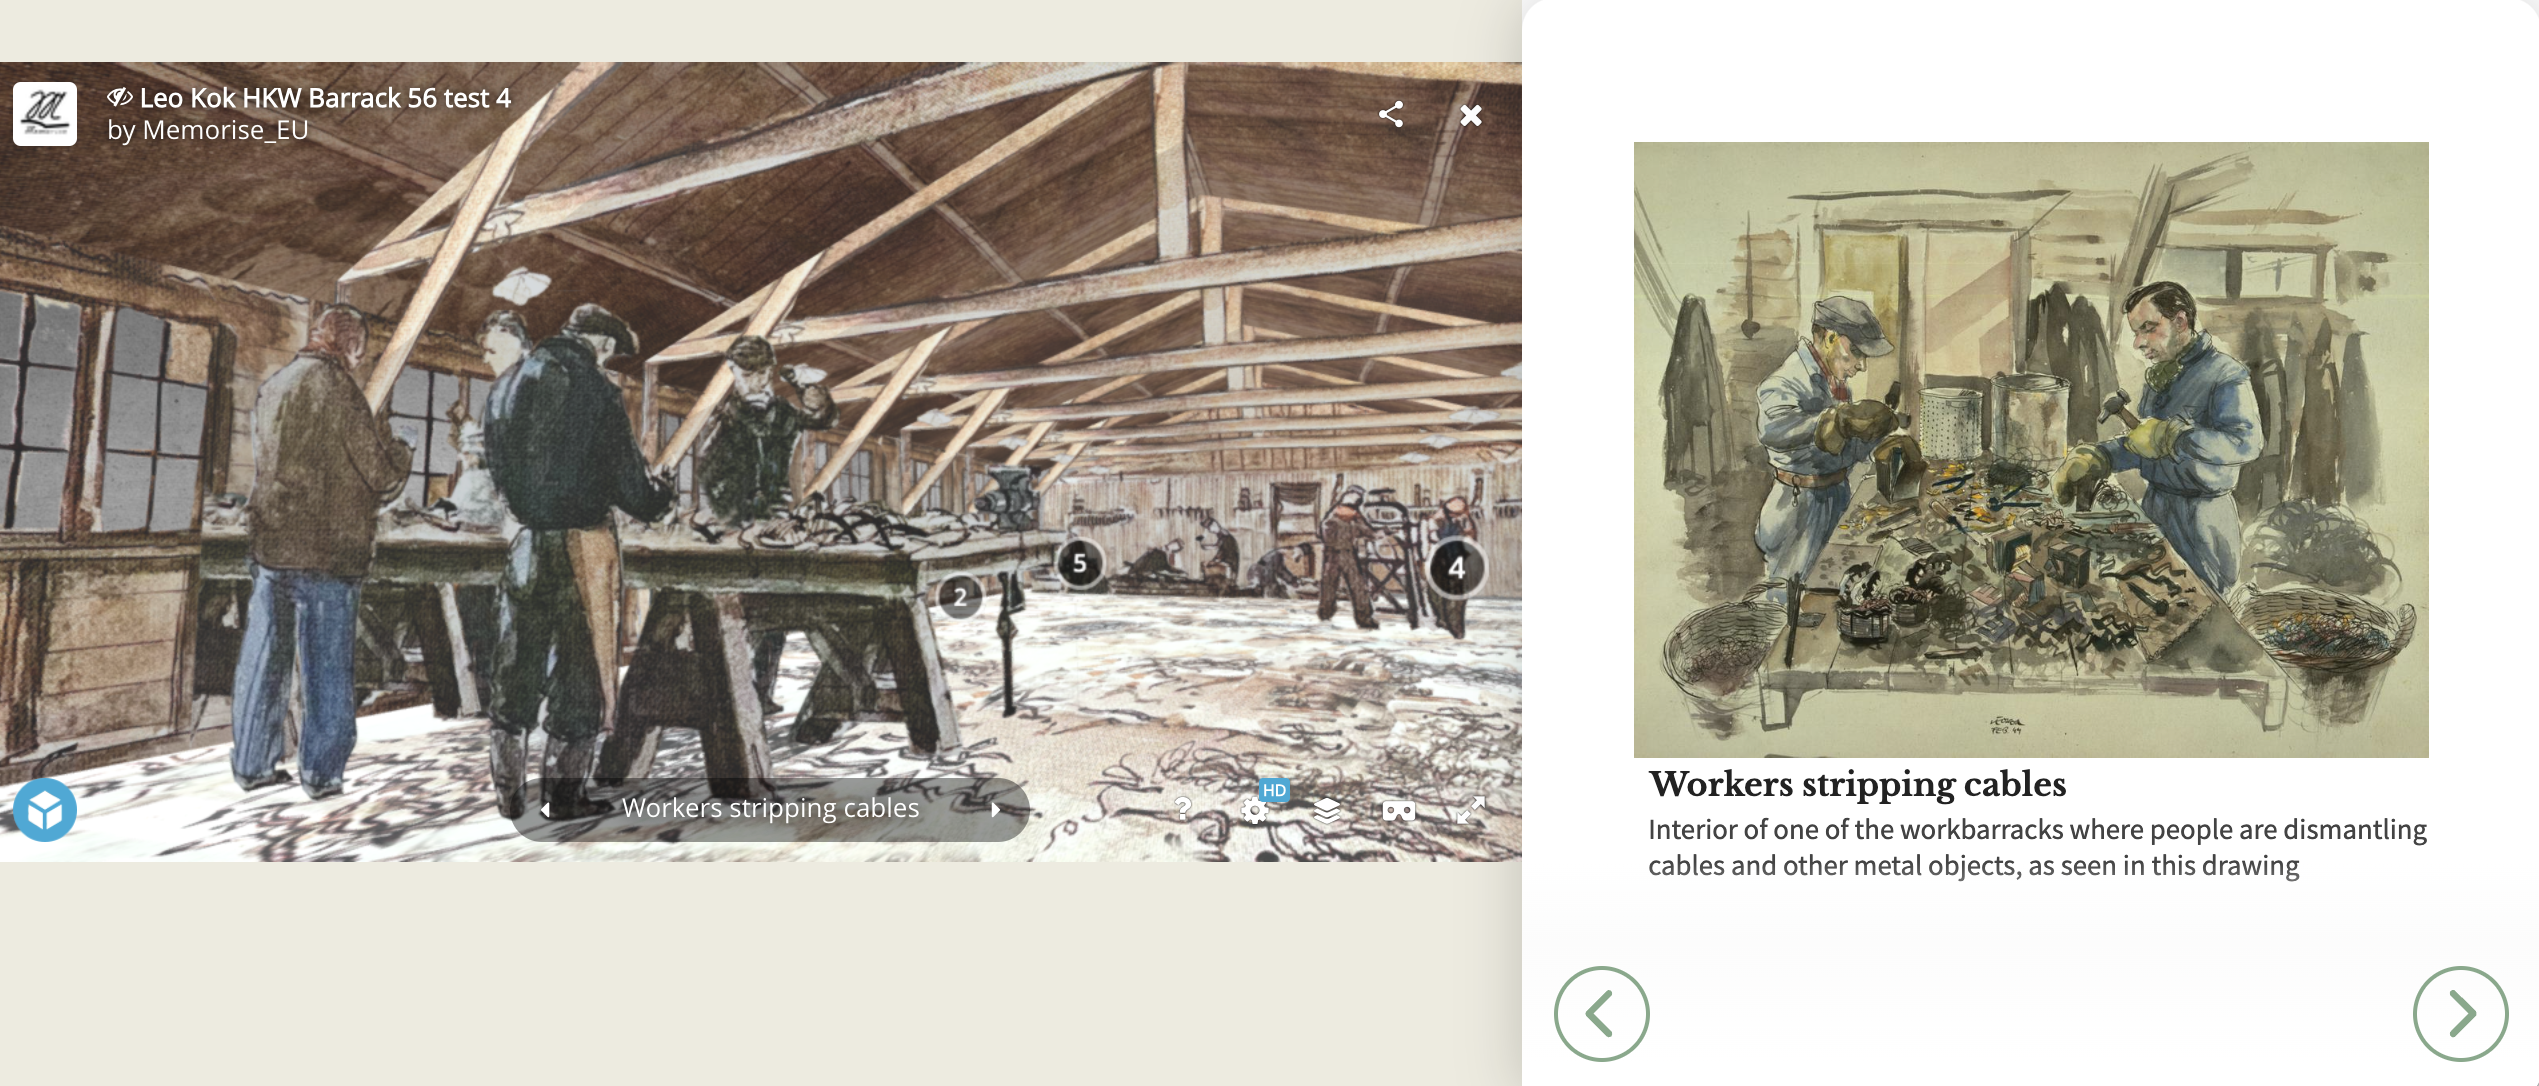
The poster highlights the case of Belgian painter and costume designer Leo Kok. His life story is a focal point, from his education to his experiences in different concentration camps. Despite the tragic end of his life shortly after liberation, brighter moments, such as his wedding in one of the camps, are also depicted. Kok's artworks, particularly his portrayal of barracks and life in the camps, are key visual elements in this storytelling approach. This individual-focused narrative aligns with the findings of Prince (1980), who discusses the profound impact of the Holocaust on personal identity.
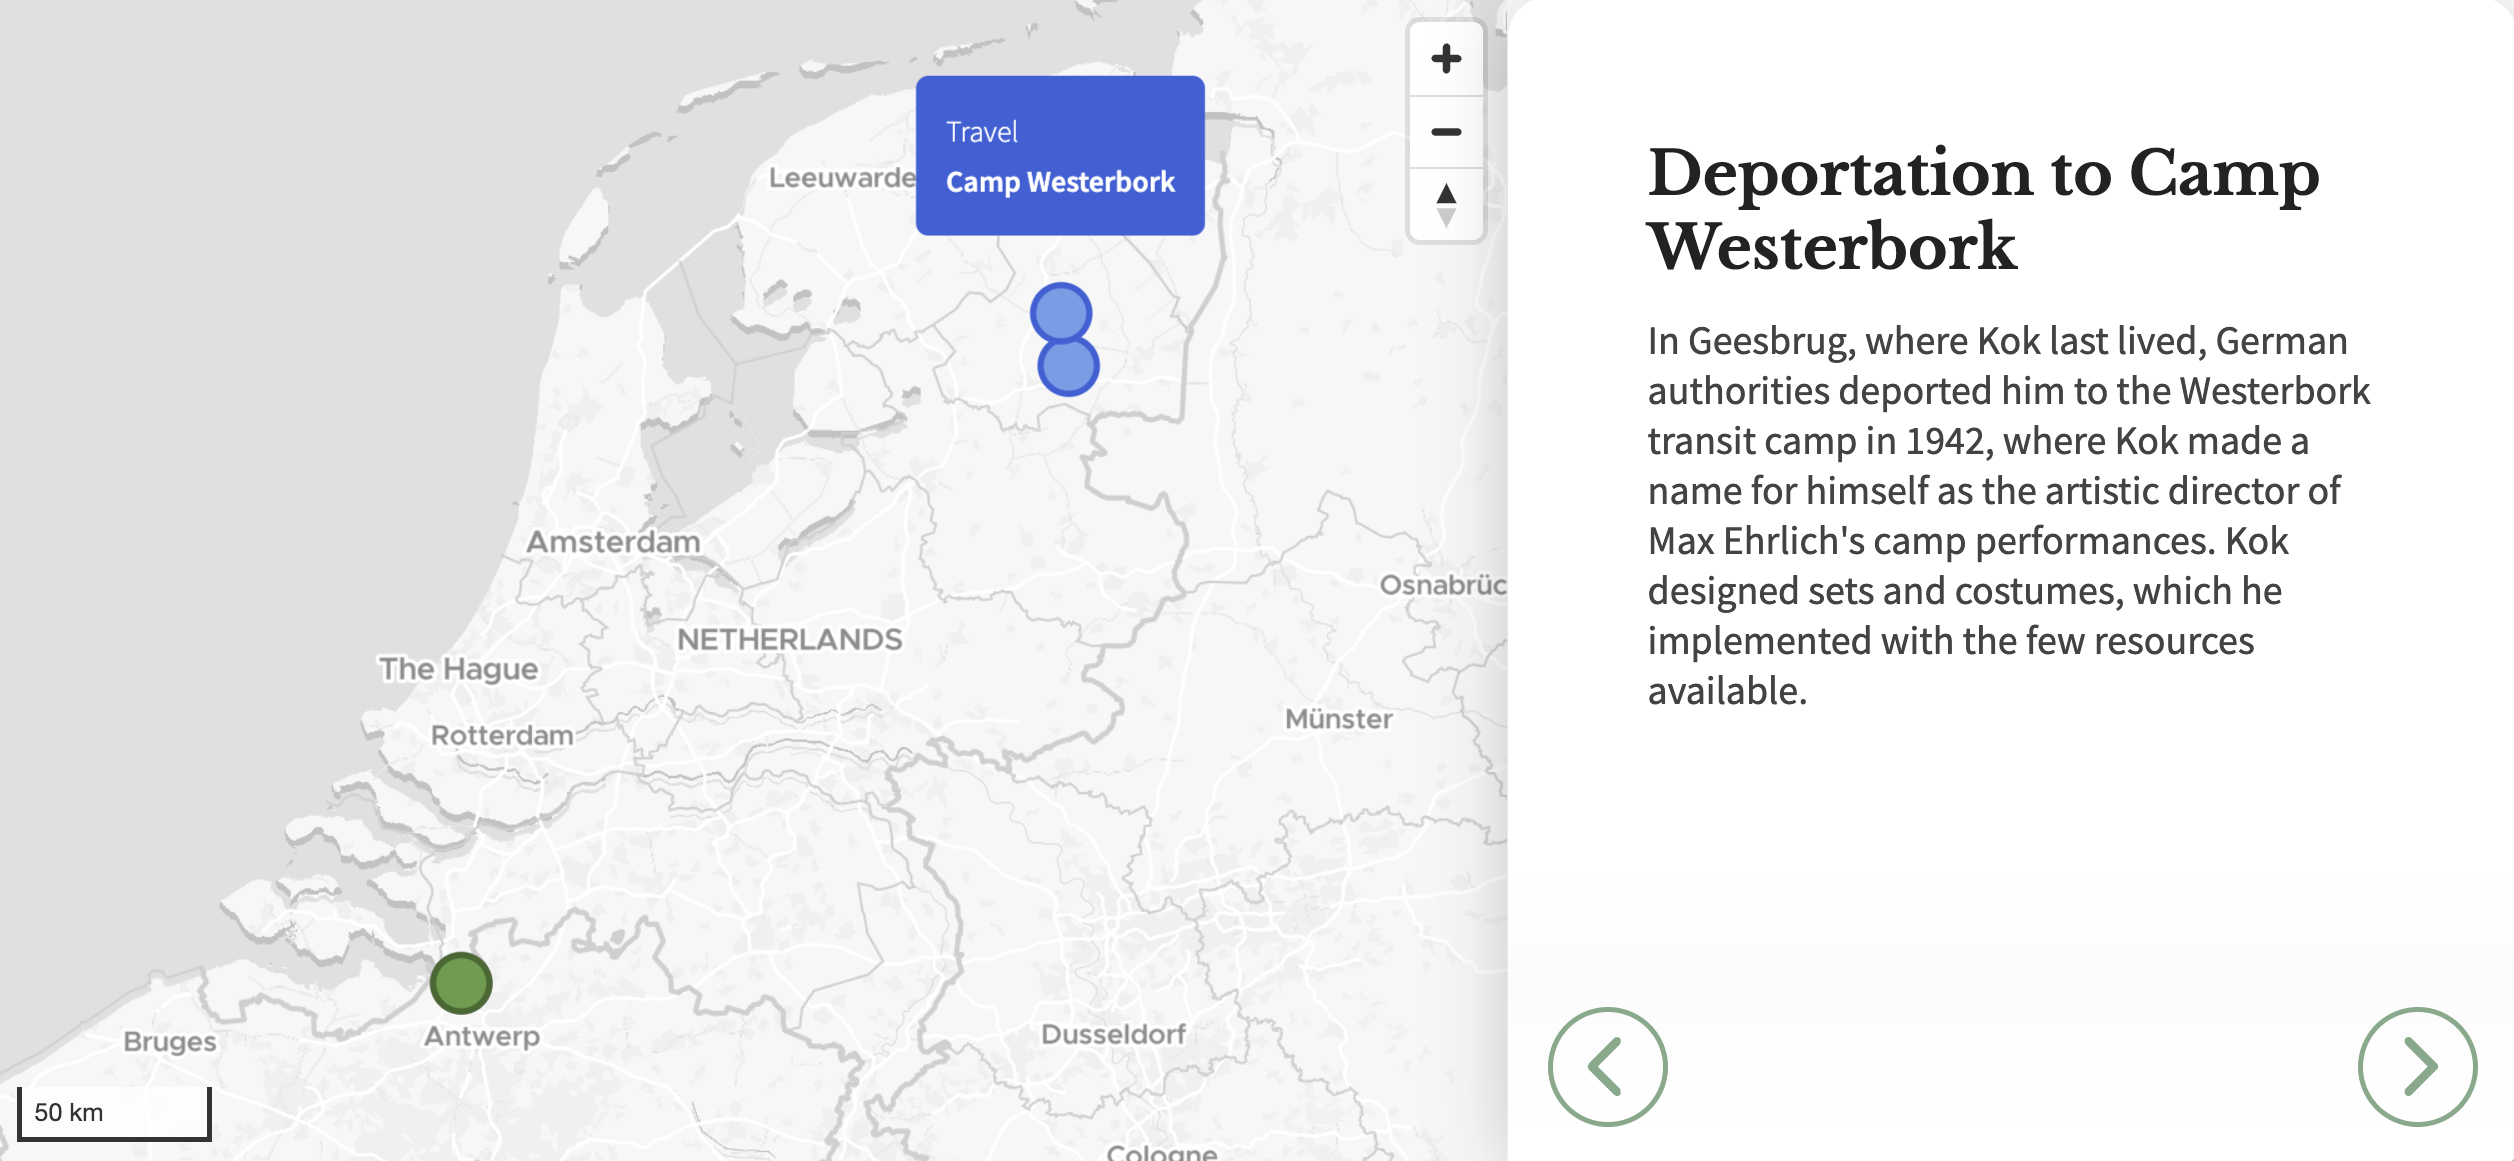
Figure 2: Next to the timeline and network graph visualizations, the map view allows to show the trajectories of lifetime events creating a sense for spatiality of stories and protagonists.
Various visualizations are employed to depict individual biographies like Kok's and the interconnected stories of multiple individuals. This includes the stories of other notable figures, like chemical engineer Otto Birman and textile designer Lisbeth Oestreicher, each bringing their unique perspective and experiences. Their art, depicting barracks and life conditions, offers a unique perspective on the Holocaust.
One critical feature of this visualization is the interactive three-dimensionalization of artworks, transforming static scenes into dynamic, explorable environments (Hall et al., 2024). This interactivity not only enhances the audience's engagement but also deepens their understanding of the historical context and personal stories.
Except for Otto Birman, they all exist in the InTaVia knowledge graph but with only a few pieces of information and no temporal or spatial annotated events, so manually curated data enriched their biographies. This status of available information will improve through further developments in the Memorise
2
knowledge grahp.
3.
Conclusion
This poster emphasizes the importance of digital platforms in making information accessible to remote collaborators, facilitating a broader dissemination of these stories.
Through interactive slideshows and various visualizations, the project aims to make the content more tangible and serve as a poignant reminder of this dark historical period. The goal is to ensure that these narratives are not forgotten but rather preserved and understood by future generations through, for example, teaching in schools and memorials as a testament to the resilience of the human spirit in the face of unimaginable adversity.
4.
Acknowledgments
This project is funded by the European Union's Horizon Europe research and innovation program under grant agreement No. 101061016. The authors are solely responsible for this work which does not represent the opinion of the European Commission. The European Commission is not responsible for any use that might be made of the information contained in this paper.