1.
Introduction
In the 19th century, Western cartographers often portrayed distant lands in a process that can be inscribed in the broader context of colonial practices (Huggan 1989). Constraints such as limited time, reduced accessibility, biases, and insufficient local knowledge resulted in inaccuracies and fabrications (Ashcroft et al. 2013), and in a prevalent reliance on duplicating existing work. A key example of this phenomenon is Jerusalem, also due to its immense historical and religious significance.
In Jerusalem, these inaccurate depictions supported a colonial sense of entitlement by favoring the narrative of an ancient past and a decayed land over its modern landscape. (Talbot et al. 2020). One key example of maps’ impact on Jerusalem can be seen in its ethno-religious subdivision into quarters, a Western cartographic invention introduced in the 19th century (Arnon 1992), now commonly accepted.
This research delves into the Western depiction of Jerusalem in 19th-century maps through digital cartometry, highlighting the unconscious yet consequential impact of colonial attitudes on cartographic practices. By digitally analyzing these maps, this study proposes new quantitative ways to compare cartographic distortions as a means to highlight how misrepresentations, and the potential biases behind them, were encoded in maps and how, by propagation, they became accepted in the representation of the city. This approach uses digital tools for distortion analysis and comparison, enabling a novel quantitative method to examine cartographic inventions and error propagation.
This study aims to uncover a hidden layer of information within maps, providing historians with an analytical framework to examine how deformations and errors were encoded and propagated, and how explorers' ideologies influenced these inaccuracies. Ultimately, this approach could be valuable for analyzing other colonial contexts as well.
2.
Background and Significance
Maps are increasingly recognized not merely as neutral representations but as power instruments to control the territory, akin to Foucalt’s state institutions (Bellone et al. 2020). According to critical cartography, maps do more than reveal knowledge about the world: they actively participate in its creation, shaping perceptions and consolidating power. In other words,
“maps make reality as much as they represent it” (Crampton and Krygier 2015, 15). As such, they should be considered in their inherent subjectivity and studied in their historical context as social documents (Harley 1990).
This subjectivity is exemplified in their distortion of reality, since maps must lie to provide functional geographical information (Monmonier and De Blij, 1996). This can happen by favoring some elements over others and silencing alternative narratives: a feature of cartography that Wood (1992) identified as
selectivity. But in contexts that are foreign to the mapmaker, maps can also contain fictitious and invented content (Ashcroft et al. 2013). As such, when considering colonial and postcolonial places it’s particularly important to analyze these errors, in order to frame their content back to their historical context.
Digital Humanities can offer novel methodologies to help expose these misrepresentations. By doing so, maps can be studied as historically contingent facts and be employed to make statements about the world (Wood 1992).
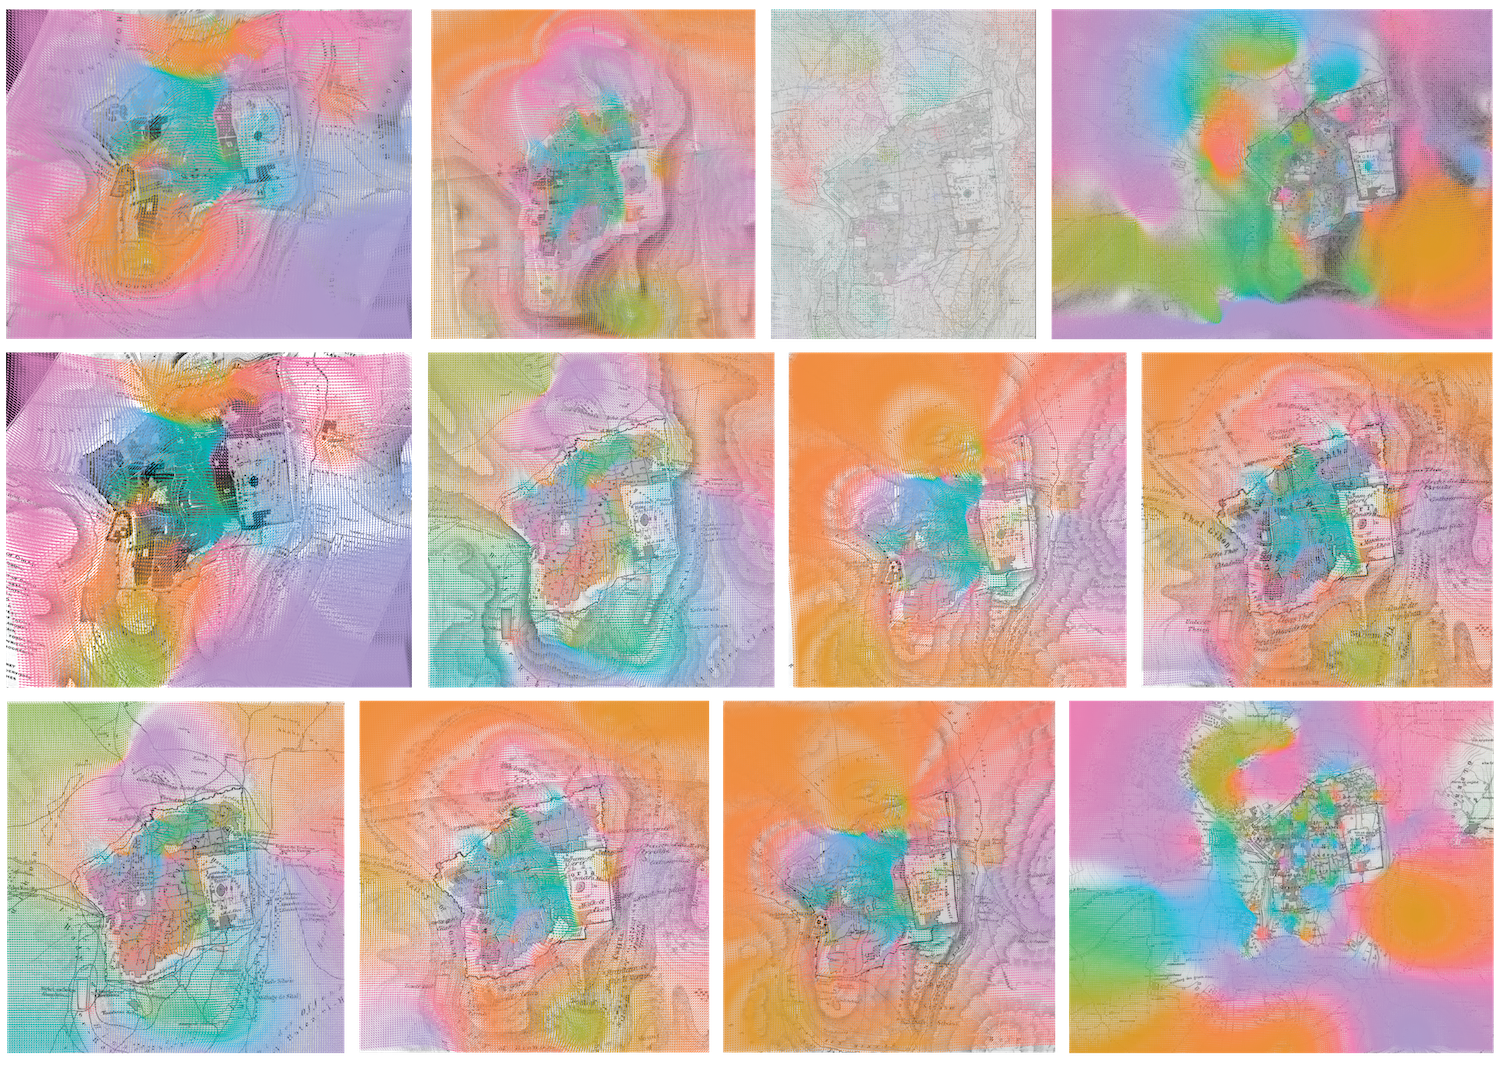
The portrayal of Jerusalem by Western cartographers during this period offers a significant case study at the intersection of digital cartometry and colonial studies. Among other places of colonial interest, in fact, the abundance of maps fostered by the religious interest over the city (more than one hundred for the 19th century) makes this the perfect example to analyze with digital tools. For this study, 50 maps from 1810 to 1872 were selected, aimed at collecting an evenly distributed temporal representation of the city in this period. In the Results, only a subset of the most relevant maps will be shown as examples (Figure 1).
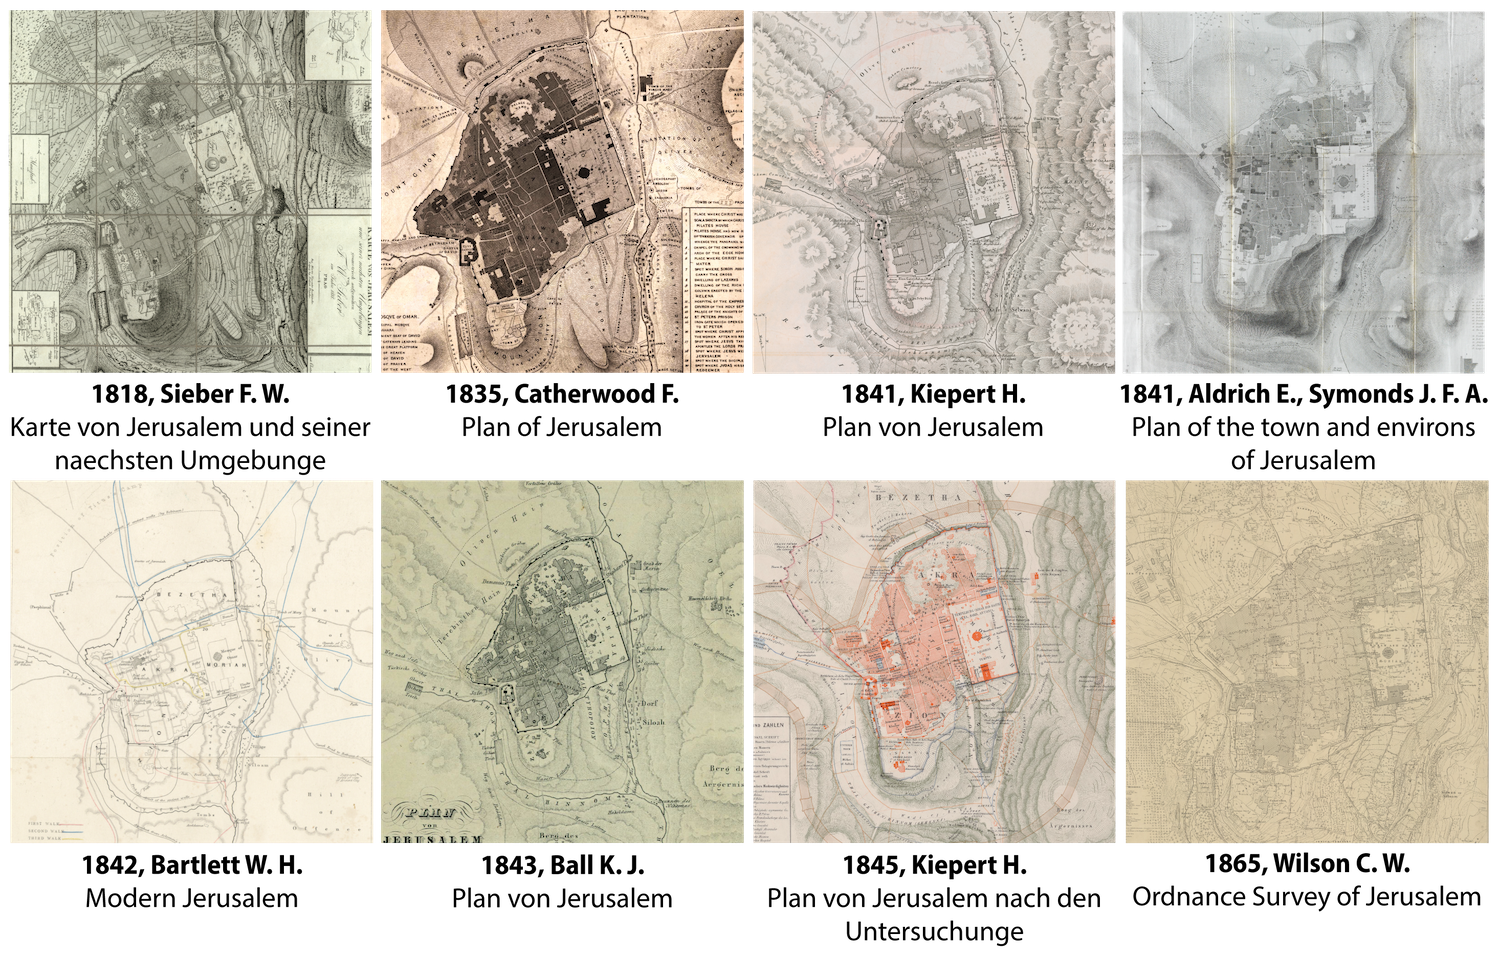
Figure 1. A selection of maps of Jerusalem between 1818 and 1865, which will be used for the analysis. Some of these maps exhibit major distortions, particularly evident when comparing the varying shapes of the city walls with the most accurate representation from the latest Ordnance Survey map.
3.
Digital Cartometry
Blakemore and Harley (1980) subdivided three interdependent types of accuracies in cartography: (a) chronometric, (b) geodetic and planimetric, and (c) topographical, highlighting the connection between these and the possibility to identify stemmatic relationships. In our study we focus on planimetric accuracy, as the assessment of
"the extent to which distances and bearings between identifiable objects coincide with their true values" (Laxton 1976, 40).
Jenny and Hurni (2011) proposed methodologies for analyzing and visualizing this type of distortion in old maps, and highlighted the possibility of using these visualizations to assess the copying process and understand the survey origins of map areas. Then, Boùùaert et al. (2016) proposed an improved methodology, based on differential distortion analysis. However, these methodologies focused mainly on the visual analysis of a small number of maps and didn’t have the need of dealing with comparison and map lineage.
The numerous maps of Jerusalem, however, require a large-scale approach, in order to be able to conduct a quantitative comparison.
4.
Methodology
Our methodology aims to employ the map’s deformation as a signature that can assess its correlation with other maps, as well as evaluating the intensity of the distortion.
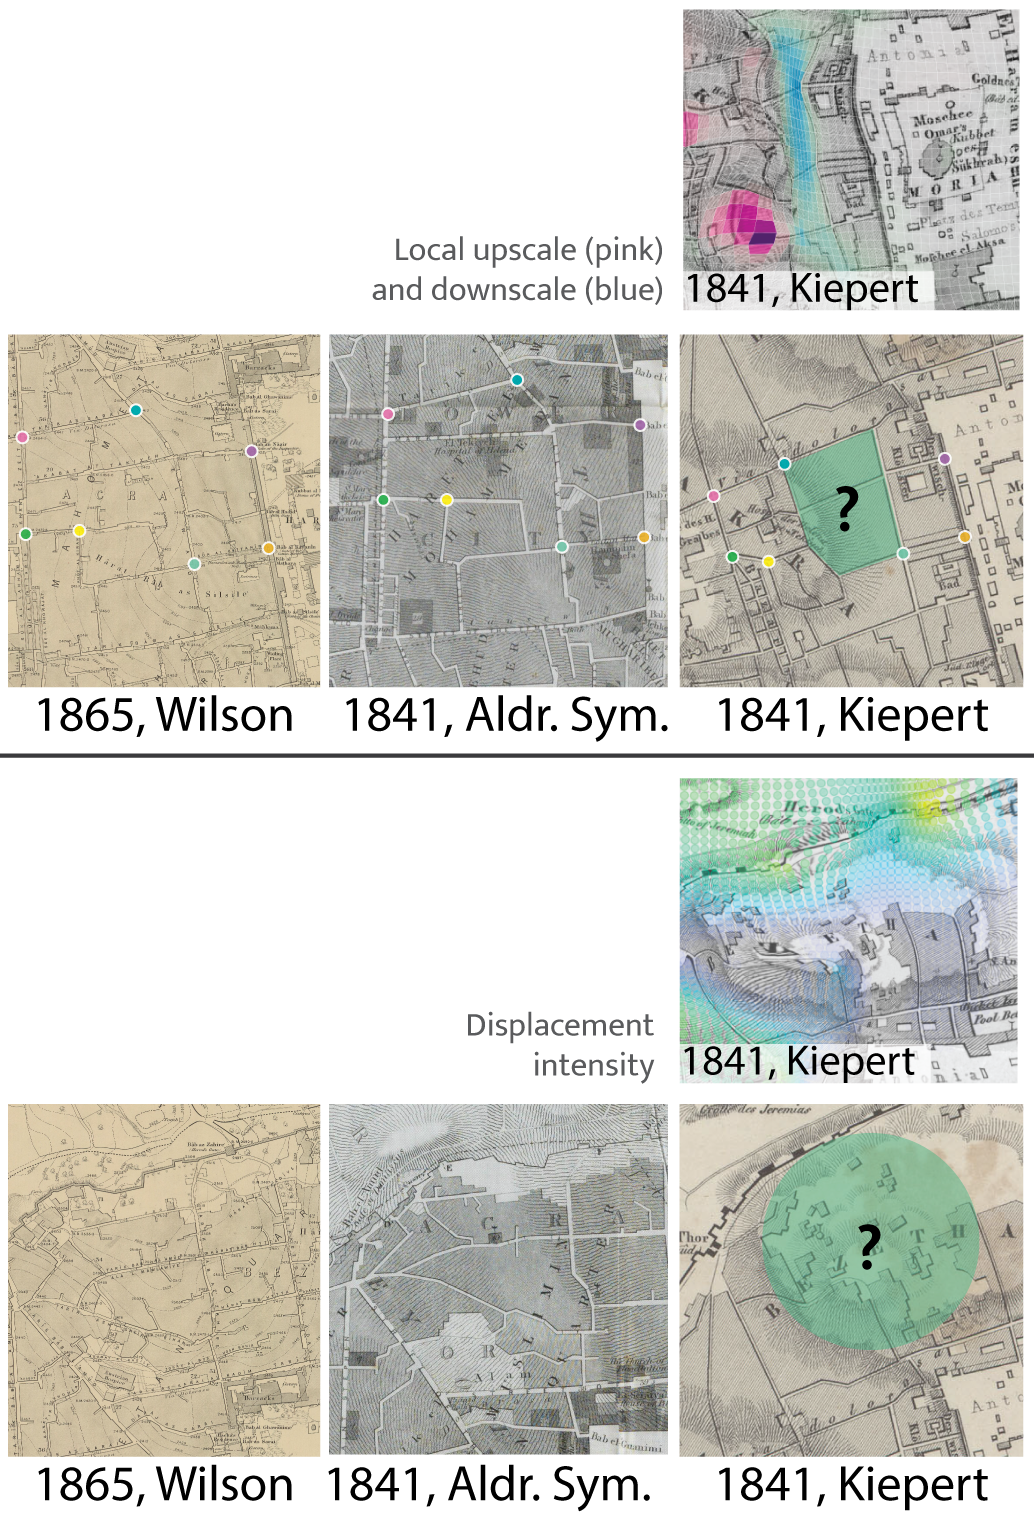
The first step involves georeferencing the maps through the definition of Ground Control Points (GCPs), which are then pre-aligned using an affine transformation. For each map, we generate a regular grid, with an adjustable cell size and with the extent of the GCPs. We employ the vectors that are defined by the pairs of GCPs to deform the grid using Radial Basis Function (RBF) interpolation, obtaining a deformed grid, which represents the intensity and direction of deformation (Figure 2).
This vector field can now be employed to: (1) assess the most misrepresented areas by determining the most likely depiction based on its compatibility with the majority of later maps and the current configuration, and differentiate between zones where the local scale is lower or higher than the global scaling derived from the alignment; and (2) perform a comparison between the overlapping portions of the vector fields.
Figure 2. A visualization of the vector fields.
5.
Results
The vector fields can be used to derive traditional cartometric visualizations and spot local misrepresentations. In this contribution we will focus on local scaling and intensity of displacement. We will show examples of different typologies of local errors that can be identified with this approach on a subset of maps
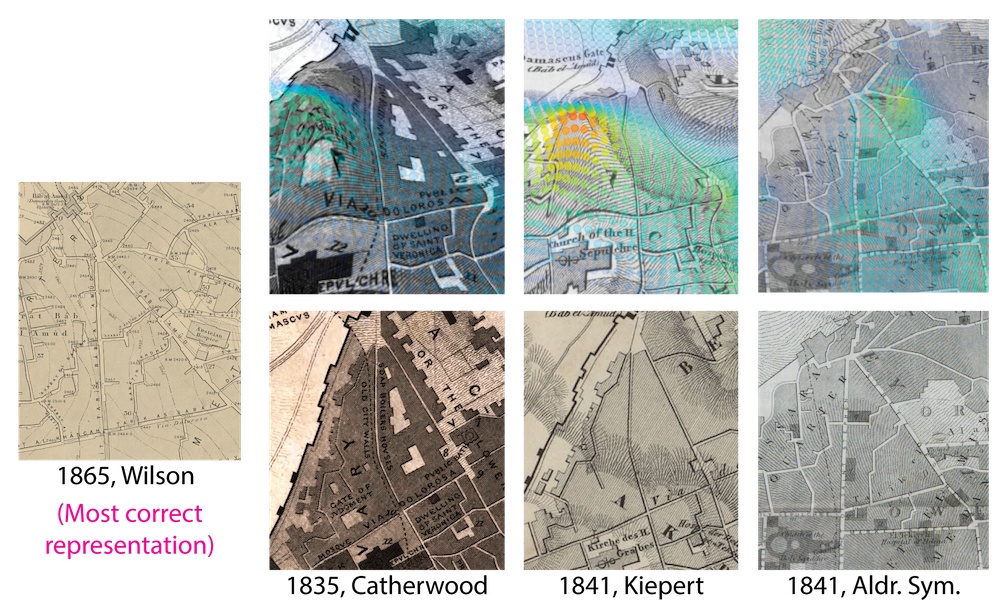
- Deformation represents a basic form of misrepresentation, where a zone is represented correctly in terms of content, but moved or scaled substantially from its actual position (Figure 3)
Figure 3. Distortion in the area in the north of Via Dolorosa before Aldrich and Symonds’ correction.
-
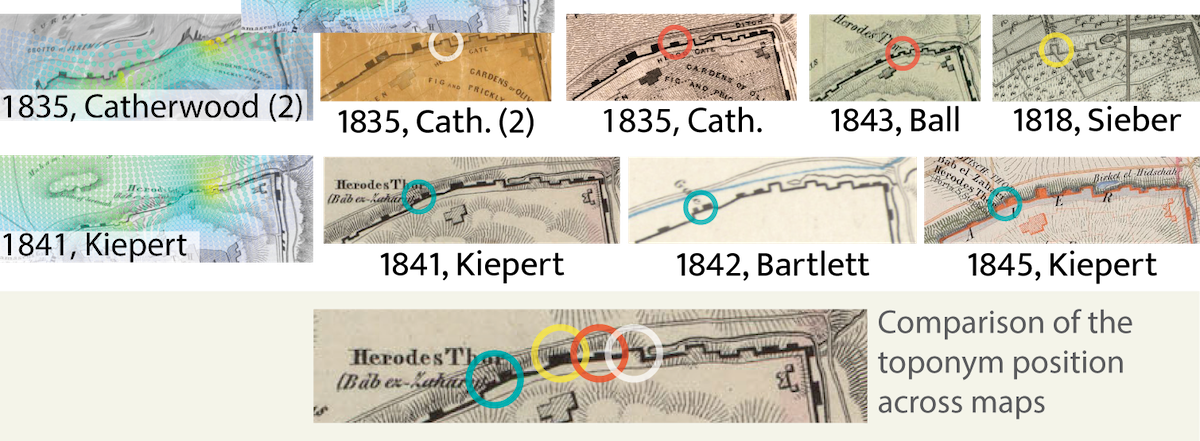
Displacement of toponyms: in the areas where the representation appears particularly uncertain, the copying process is sometimes accompanied by a moving position of a toponym (Figure 4).
Figure 4. Herod’s gate (Bab az-Zahra) is an example of how a copy can have a displacement of toponyms that can express confusion over a certain area.
-
Topological error: in some cases, the deformation is related to an error in the content. In this case, the topology of the road network cannot be retrieved between maps (Figure 5).
Figure 5. In Kiepert’s map, the west of Haram al-Sharif and the north-east corner of the Old City presents a road network that is incompatible with the contemporary and more accurate map from Aldrich and Symonds.
For the last two types of misrepresentation, the intensity of deformation can be used as a marker for close-reading.
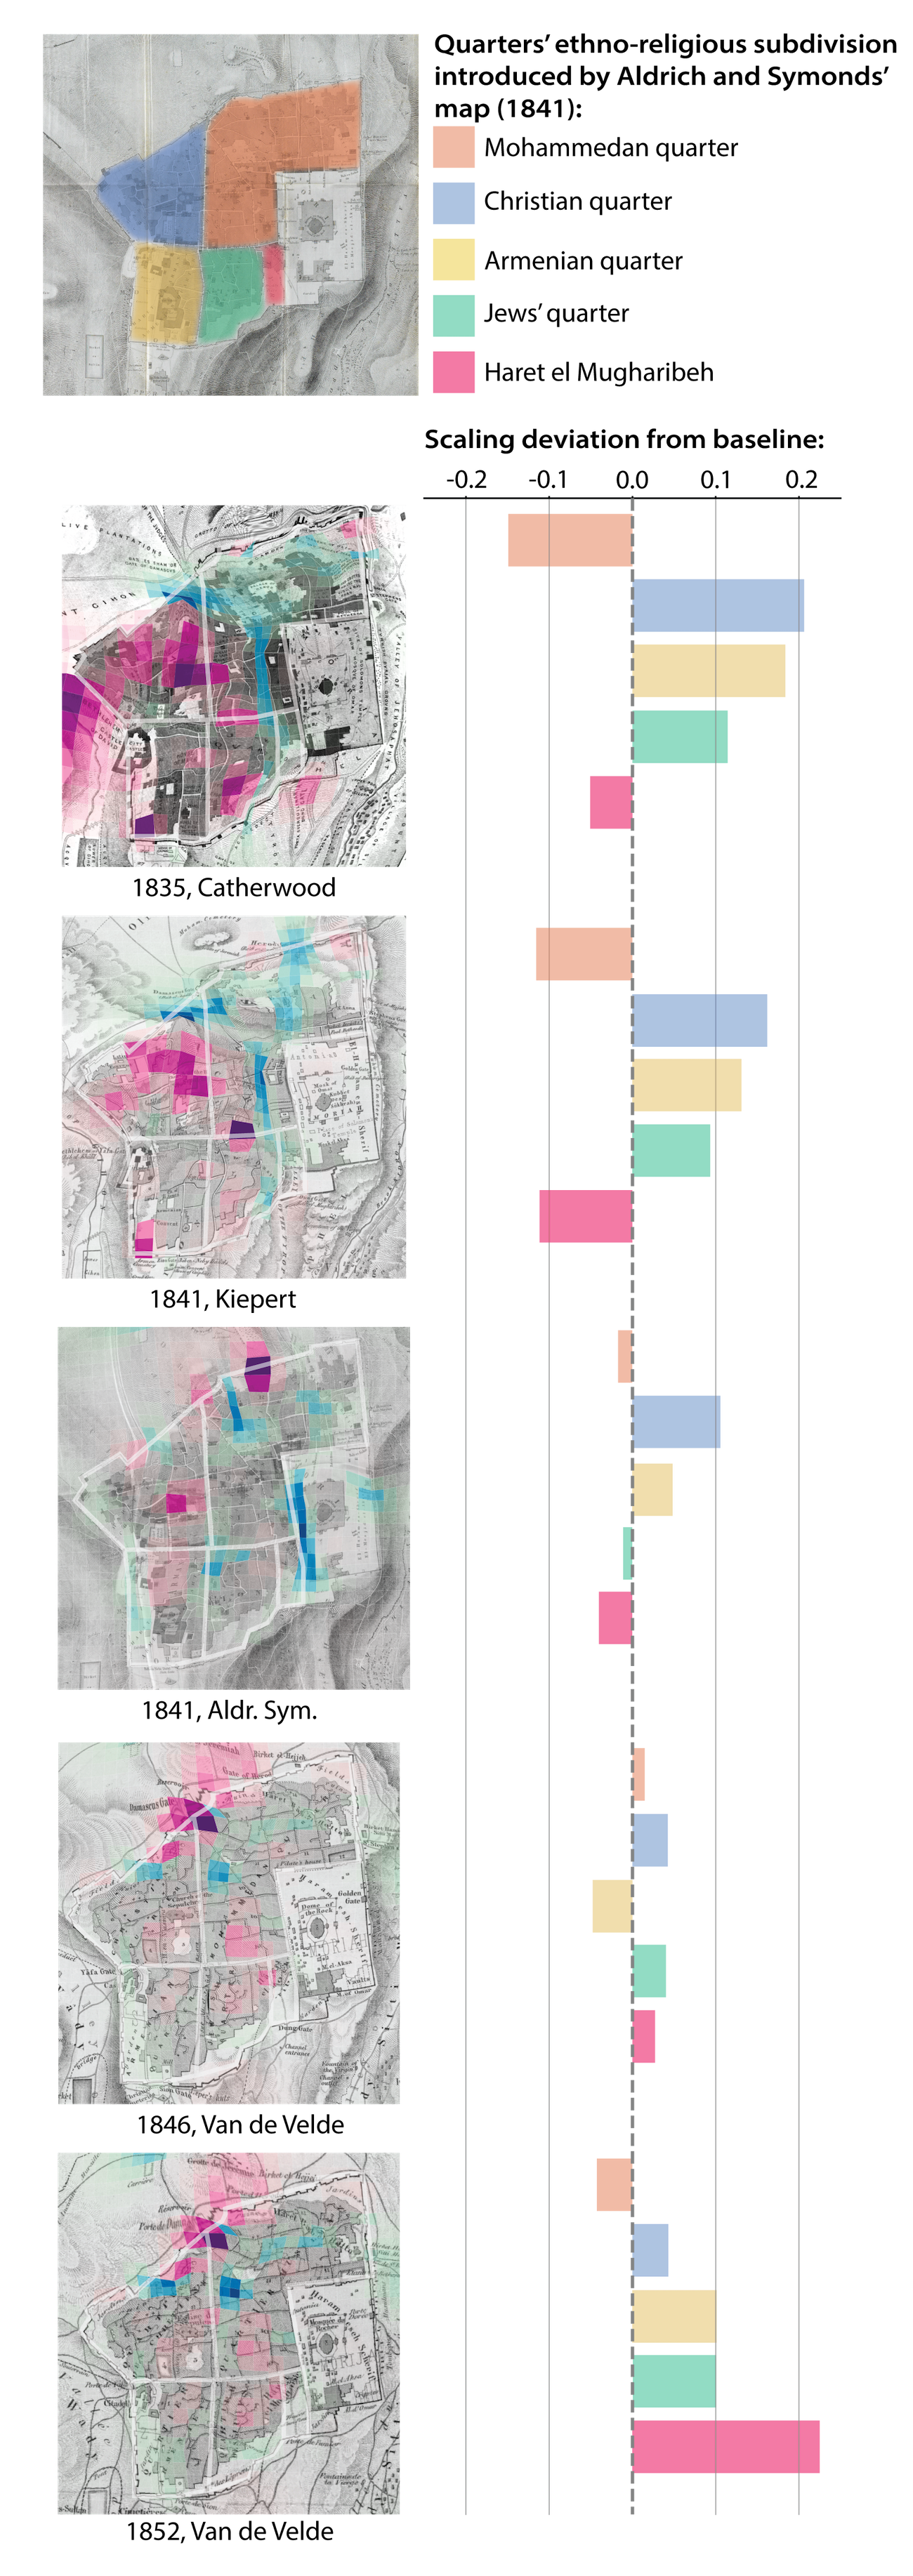
The vector field can also be used to highlight areas that are upscaled or downscaled in respect to the global scaling. Patterns of these effects can be analyzed across maps: for instance, we can notice a recurring upscaled representation of the so-called Mohammedan quarter, and a downscaled representation of the Christian quarter (Figure 6).
Moreover, the proposed methodology opens up the possibility of using the vector field directly to highlight similarities between maps diachronically. This is particularly interesting in all the cases where many maps are available for a limited timeframe.
Figure 6. On the maps: areas represented as smaller than reality (pink) and areas represented as bigger than reality (blue). On the right: plot of the scaling (%) in each of the ethno-religious quarters. A positive value indicates an area that in the map is represented as smaller than reality.
6.
Conclusion
This study introduces a new methodology to highlight cartographic errors through deformative analysis. Using 19th century Jerusalem as a case study, we showed examples of how the extracted deformation can be employed to identify different types of inaccuracies and errors. This approach paves the way for a more thorough study of the historical implications and reasons behind western cartographic inaccuracies. By exposing these errors and deformations, digital humanities can contribute to challenge what could be considered as an objective representation of the past, especially in contexts where the accessibility to endogenous narratives is limited.
Appendix A
Bibliography
-
Arnon A.
(1992) “The Quarters of Jerusalem in the Ottoman Period”. Middle Eastern Studies, 28(1): 1-65.
-
Ashcroft B. / Griffiths G. / Tiffin H.
(2013)
Postcolonial Studies: The Key Concepts.
-
Bellone T. / Engel-Di Mauro S. / Fiermonte F. / Armano E. / Quiquivix L.
(2020).
Mapping as tacit representations of the colonial gaze
in “Mapping Crisis: Participation, Datafication and Humanitarianism in the Age of Digital Mapping”: 17-38.
-
Blakemore M. J. / Harley J. B.
(1980) “The Search for Accuracy”. Cartographica 17(4).
-
-
Crampton, J. / Krygier, J.
(2010). “An Introduction to Critical Cartography”. ACME: An International E-Journal for Critical Geographies. 4.
-
Harley, J. B.
(1990) "Cartography, ethics and social theory." Cartographica 27(2): 1-23.
-
Huggan, G.
(1989) “Decolonizing the Map: Postcolonialism, Post-structuralism and the Cartographic Connection”, Ariel 20(4): 115–31.
-
Jenny B. / Hurni L.
(2011) "Studying cartographic heritage: Analysis and visualization of geometric distortions." Computers & Graphics 35(2): 402-411.
-
Laxton P.
(1976) “The Geodetic and Topographical Evaluation of English County Maps,
1740-1840”, The Cartographic Journal, 13(1): 37-54.
-
Monmonier M. S. / De Blij H. J.
(1996). How to lie with maps. University of Chicago Press.
-
Talbot M. / Caldwell A. / Emmot C.
(2020) “Perceiving Palestine: British Visions of the Holy Land”. Jerusalem Quarterly, 82: 50-76.
-
Wood, D.
(1992) “The Power of Maps”. New York: Guilford Press.
-
Maps from:
Eran Laor Cartographic Collection, National Library of Israel.